
The Statistics tab is designed to help you understand your conversion funnel. By tracking these metrics, you can see what marketing efforts are working and where you might need to adjust your strategy to maximize your commissions.
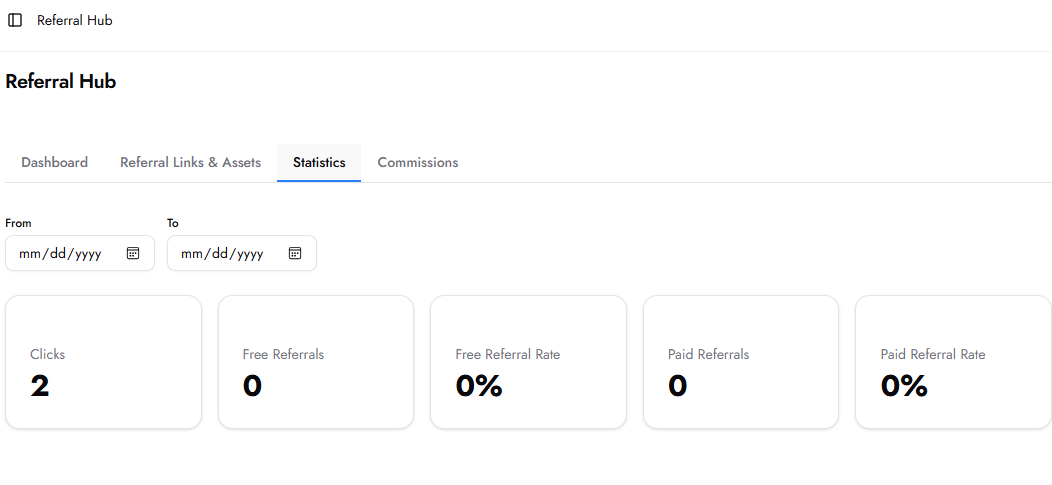
1. Date Range Filtering
At the top of the page, you will find From and To date selectors. This allows you to filter all the data on the page by a specific timeframe.
Use case: Use this to track the success of a specific email campaign or social media post you sent out during a particular week.
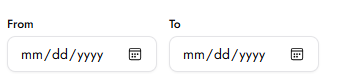
2. Key Performance Metrics
The dashboard breaks down your traffic and conversions into five key data points:
Clicks: The total number of times someone has clicked on your unique affiliate link. This measures your overall reach and traffic volume.
Free Referrals: The number of users who clicked your link and signed up for a free account or trial. These are your warm leads.
Free Referral Rate: This is your "Lead Conversion Rate." It shows the percentage of people who clicked your link and actually signed up for a free account. (Example: 100 clicks and 10 free signups = a 10% Free Referral Rate).
Paid Referrals: The number of users who have converted into paying customers by purchasing a license. These are the referrals generating your 45% commission.
Paid Referral Rate: This is your "Sales Conversion Rate." It shows the percentage of your total traffic that successfully turns into a paid subscription.

Why These Stats Matter
By monitoring these numbers, you can identify where to improve:
High Clicks / Low Free Referrals: You are getting people to look, but they aren't signing up. You might need to better explain the value of the platform when you share your link.
High Free Referrals / Low Paid Referrals: You are great at getting people in the door! You may want to follow up with your leads to help them understand which paid tier (Starter, Growth, or Professional) best fits their agency needs.