The Impact Report shows a business what its marketing is missing and what Growbotik can do for it: how many new clients a month, at what cost per lead, and how much revenue. Behind it is a 12-month Growth Plan with a month-by-month breakdown. Growbotik builds both in one click.
Step 1: In the lead list, tick the businesses you want. To run a report for one lead, you can also open it and click Run Impact Report.
Step 2: Click Generate impact reports.
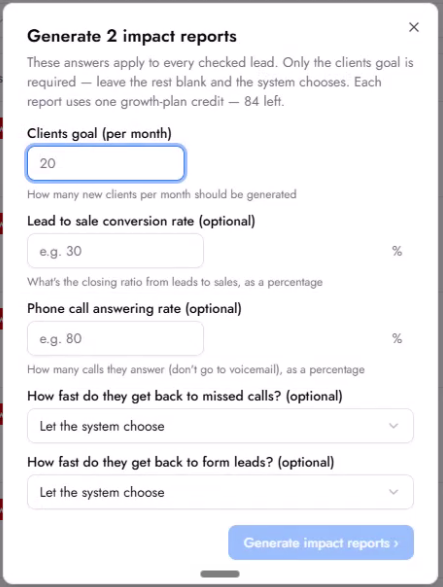
Step 3: Fill in the form. Only the clients goal is required. Leave the rest blank and the system chooses, based on averages for the niche and area.
Clients goal (per month): how many new clients a month the business should get.
Lead to sale conversion rate (optional): the share of leads that become customers. If you know the niche, for example 25%, enter it.
Phone call answering rate (optional): how many calls out of 100 the business answers instead of sending them to voicemail. Small businesses often miss a lot of calls.
How fast do they get back to missed calls? (optional): usually 1 to 4 hours.
How fast do they get back to form leads? (optional): usually 1 to 4 hours.
Step 4: Click Generate impact reports.
The answers apply to every lead you ticked, and each report uses one growth-plan credit. A report takes 10 minutes or more, because the system runs a full analysis. You can keep working in the meantime: analyze websites, get contacts, or generate websites for other leads.
The headline
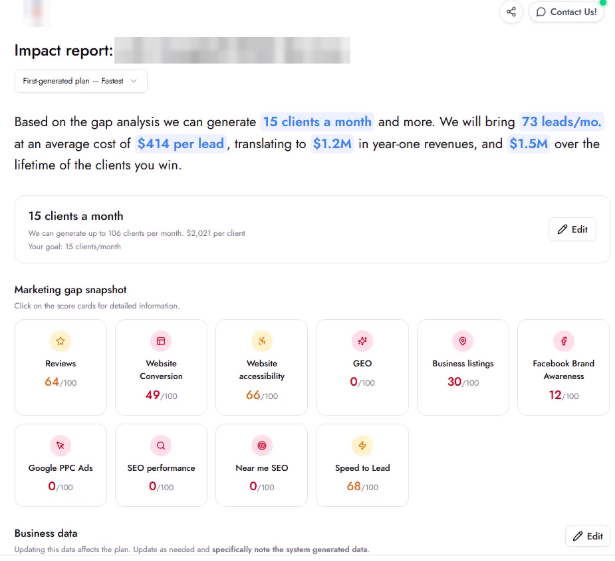
The top of the report is written for the business owner. For example: "Based on the gap analysis we can generate 15 clients a month and more. We will bring 73 leads a month at an average cost of $414 per lead, translating to $1.2M in year-one revenue." Everything the owner needs to know is in that paragraph.
The goal
Click Edit next to the clients goal to change it, for example from 15 to 30 clients a month. The report is recalculated. More clients usually means more advertising, so the cost per lead goes up. At very high volumes, ads get even more expensive, because the business needs more ad space at the same time.
Marketing gap snapshot
Scores out of 100 for Reviews, Website Conversion, Website accessibility, GEO, Business listings, Facebook Brand Awareness, Google PPC Ads, SEO performance, Near me SEO, and Speed to Lead. Click a score card for the details. For example:
Reviews: the business compared with the top three businesses in the Google map pack, which get 46% of the clicks.
Website Conversion: a plain-language summary of what works and what does not, quoting the business's own website.
GEO: whether AI assistants, such as Gemini, recommend the business, and which competitors they recommend instead.
Business listings: whether the business's details match on Google, Yelp, and Bing. A different phone number on each site hurts the business on Google.
Google PPC Ads: how many leads a month the business is missing, the keywords, and the average cost per click.
SEO performance: the keywords the business does not rank for. The system generates 30 to 50 keywords and shows the most relevant ones.
Near me SEO: where the business ranks on the map for "near me" searches around its location. Many businesses fall to the second page just a couple of miles away.
Speed to Lead: how fast the business answers calls and forms. Great marketing fails if nobody picks up, which is why plans include an AI voice agent and chatbot that catch missed calls and chats.
Business data
The numbers the plan is built on: lead-to-client conversion, call answer rate, response times, average ticket value, and customer lifetime value. Values the system estimated are marked System generated. If you know the real numbers, click Edit and update them. The whole plan is recalculated.
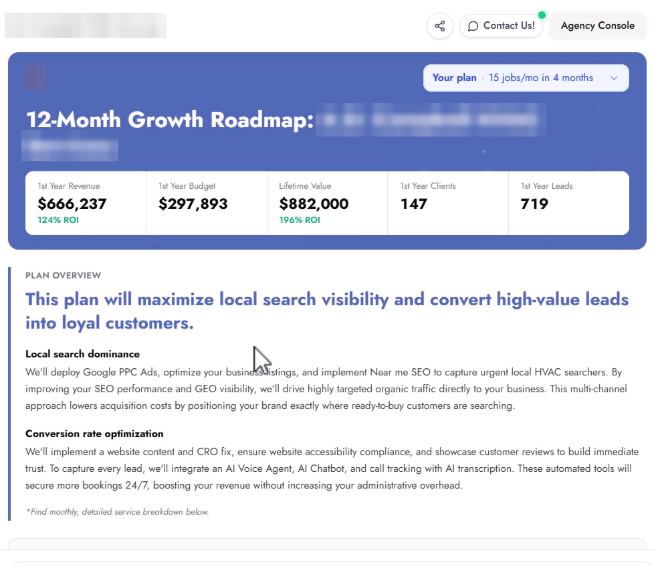
Click Review detailed growth plan. The Growth Plan shows the first-year revenue, budget, ROI, clients, and leads, and a month-by-month breakdown of the work. Month 1 is usually a setup month with no revenue, for example tracking, SEO, Near me SEO, the AI voice agent and chatbot, listings, reviews, and accessibility. Then paid advertising scales up.
To adjust the plan, click Agency Console. For example, lower the advertising budget to 50% or 30%, or remove the website work if the business already has a website. See the Agency Console article.
Click Share in the lead's header and copy the Impact report link, or copy both the website and report links. The report has a Contact Us button that reaches you.
The report is grounded in real data. Advertising and ranking data comes directly from Google, and projections are based on more than 10 years of running marketing for these kinds of businesses. The data is updated as marketing changes.
Does an Impact Report use credits?
Yes. Each report uses one growth-plan credit.
How long does a report take?
10 minutes or more. You can keep working while it builds.
Which fields do I have to fill in?
Only the clients goal. The system fills in the rest, and you can change the numbers later.
Can I change the numbers after the report is ready?
Yes. Edit the goal or the business data, and the report is recalculated.
Do I have to share all three plans?
No. You decide what to share.
Why does the cheapest plan bring fewer clients?
It relies mostly on organic marketing, which is cheaper but has a limit and takes longer. To get more clients a month, the plan needs advertising, which raises the cost per lead.